The Data Collection Handbook · Part I. Foundations
Chapter 1. The Data Collection Landscape
Picture two companies selling the same espresso machine online. On a Tuesday night, a marketplace seller undercuts them both. The first company knows by morning: a collection job read the public listings overnight, the change landed in a dashboard, and a category manager repriced before lunch. The second company finds out in the quarterly review, from a slide, after the lost sales have already gone somewhere else. Same product, same market, the same listing sitting in public view. One company treats the public web as raw material for decisions and collects it on purpose. The other is flying blind and calling it normal.
Closing that gap is the industry this book is about. The work has a plain definition: using software to fetch publicly visible web pages and app responses, at a load the source can comfortably serve, and turning what comes back into records. A record is one delivered row of data. One product with its price, one flight with its fare. Decisions run on this raw material, and the raw material about the world outside your own walls, what competitors charge, what is actually in stock where, sits mostly on the open web.
I have spent years building and running these systems as a founder, mostly for retail and travel pricing. One promise before we start: every term of art gets defined the first time it appears, the way I just did with record, because this book is written for the person who signs the data contract as much as for the person who writes the code. The other thing I can tell you from inside the field is that it is wider than the word "scraping" suggests. It is a supply chain: sources on one side, decisions on the other, and a set of access methods in between whose cost and reliability decide whether it makes economic sense.
Who collects, and for what
Pricing intelligence is the vertical I know best and the easiest to picture, because you just met it. Retailers, airlines, hotel groups, marketplace sellers: anyone whose prices must answer a market that moves daily. Take the espresso machine story, multiply it by a catalog of tens of thousands of products, and run it every night. The deliverable is a reflex the company did not have before.
Market research buys breadth instead of speed. An analyst wants to know whether a category is growing, which brands are gaining share of shelf on the big marketplaces, how ratings and review counts moved after a launch. Those signals sit in public view, and in my experience, collected steadily across enough sources, they move earlier than official numbers do. Research firms collect the signals and sell the reading.
Then there are the teams assembling AI training data, the newest buyers and the hungriest ones. They collect public text and images at volumes the rest of the industry considers absurd. The practical question this vertical puts to a publisher is whether its public pages have become someone's training set without anyone deciding it; the next chapter's census measures how the biggest sites are answering.
Lead generation runs on public registries and directories. A sales team that collects new company filings and fresh job postings stops buying stale lists and starts calling the company that began hiring, this week, for the exact problem its product solves.
Monitoring is the fifth vertical, the one that never makes conference slides. Brands watch resellers for broken pricing agreements. Compliance teams hunt counterfeit listings. Publishers track where their content reappears. Nothing is priced and nothing is forecast; the deliverable is an alert that fires when the web changes in a way somebody promised it would not.
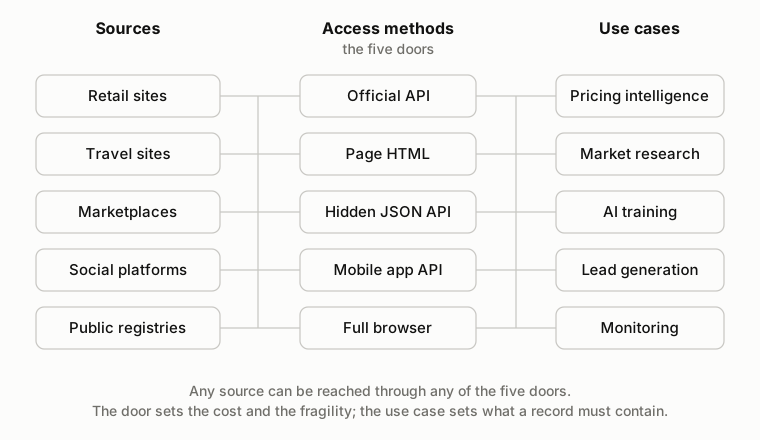
The five verticals share one supply chain. They differ in how fresh and how broad the records must be. Getting in is the next problem.
The five doors into any source
Every source I have worked with offers at most five ways in, and this book uses one canonical list for them, here and in every chapter that follows: the official API, the page HTML, the site's own hidden JSON API, the mobile app's API, and a full browser. I think of them as five doors into the same building, because the data behind them is identical. What changes from door to door is the price of walking through and how often it slams on you. An API, for the non-engineers reading: an interface a site publishes so software can request data directly and get a structured answer instead of a page meant for human eyes.
The official API is the front door with a doorbell. The site documents it, hands you a key, and promises a format. When it exists and covers the fields you need, take it and stop looking. It is the cheapest door to operate and the only one whose changes arrive with a deprecation notice, an advance warning that an old version will be shut off. The catch: most sources do not offer one, and many that do exist are rate capped or missing exactly the field you came for.
Everyone finds the page HTML door first: fetch the same page a browser would receive and parse the markup for the price node and the stock badge. It works almost anywhere, which is why the trade gets called scraping, and it is the most fragile item on this list. The site redesigns, your parser starts reading prices out of what is now a photo caption, and no notice arrives, because nobody knows you exist.
My favorite door to show people is the site's own hidden JSON API, because it hides in plain sight. A modern site is an app. The page your browser displays is assembled from data the site's frontend fetches from its own internal endpoints, and anyone who opens the browser's developer tools can watch the catalog arrive as clean, structured JSON before the visuals are painted on. Collect from that feed and you skip the markup entirely: the answers are lighter and cleaner, and a visual redesign cannot touch them. It is also undocumented and owes you nothing. It can move or change shape on any deploy, without notice, forever.
One layer further out sits the mobile app's API, the endpoints the phone app talks to. Finding them takes more work, you inspect the app's traffic instead of a web page, and some are locked behind signatures. In exchange they tend to change more slowly: a company can redeploy its website any afternoon, but breaking those endpoints would break installed apps it cannot force anyone to update.
The full browser is the door that always opens. Run a real browser with software hands, let the page render completely, read what a human would have seen. You pay for that certainty. It is the most expensive door per record by a wide margin, and since you still parse what got rendered, a redesign still breaks you. The costliest door and one of the most fragile at the same time. Sometimes it is the only one that works, and then it is the right choice, made knowingly.
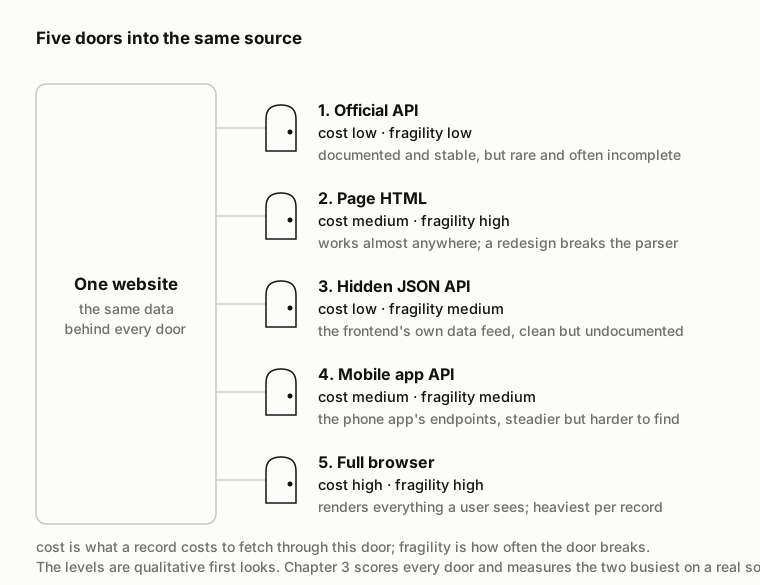
That was a first look. Chapter 3 has the fifteen minute audit that finds every door a given source exposes, scores each on cost, fragility, and completeness, and orders them into a waterfall: cheap doors absorb the volume, expensive doors rescue the failures.
And one option stays off the list on purpose. You can skip every door and buy the records ready-made from a data vendor. Buying is a decision not to access at all rather than a sixth access method, and it deserves better than the reflexes it usually gets. Engineers default to build, because building is what they do. Executives default to buy, because vendors return their calls. Both are guesses that sound like decisions. How to buy well is Chapter 14's subject. What I can do here is replace the guess with arithmetic.
Build vs buy: running the numbers
Every chapter of this book makes the same deal with you: a real question gets settled by an experiment you can rerun, and the prose follows the experiment's output rather than my instinct. The question this time: at what monthly volume of collected records does building an in-house collection capability become cheaper than buying the same records from a vendor?
The experiment is a cost model in plain Python. One command runs it, no network needed, and every number in this section comes from the run shipped with this chapter in July 2026. It prices the same job twice.
Building in house adds four costs, and the first one dominates. Engineering time: the model charges 20 hours a month just to own a pipeline at all, deploys, storage, scheduling, monitoring, before a single source is added. Then 8 hours a month of maintenance per source, a source being one website or app you collect from. Then a 60 hour build for each new collector, the program that fetches and extracts one source, spread over a 24 month working life. Hours bill at 62.50 USD, from a fully loaded engineer month of 10,000 USD over 160 hours; fully loaded means what an employee really costs, salary plus taxes, benefits, equipment, and overhead. After the people come residential proxies, intermediary IP addresses from home connections, rented by the gigabyte so that your requests travel the way ordinary traffic does: 4 USD per GB, which under the model's traffic assumptions works out to 0.60 USD per 1,000 requests, about 0.000078 USD per record. Then compute at 10 USD per million requests, and 150 USD a month of fixed small infrastructure. The vendor side is simpler: one price per record on graduated tiers, 0.01 USD per record for the first 100K sliding down to 0.0005 USD beyond 100M, matching public list prices for ready-made web data. Graduated means each tranche bills at its own rate, like income tax brackets.
Every input above is an assumption, set at market typical values, and each one lives in the shipped params.json with a one line justification. Disagree with any of them, edit the file, rerun. The model sweeps demand from 10K to 100M records a month, assumes a typical source yields a million records a month so sources get added as volume grows, and finds where the two cost curves cross. That crossing is the breakeven.
Three volumes tell most of the story. At 100K records a month, building costs 2,064 USD and buying costs 1,000 USD; the vendor wins, comfortably. At 1M the sides have already traded places: 2,136 USD to build against 5,500 USD to buy. At 10M it is 8,756 USD against 28,000 USD. The crossing sits at 316,266 records a month, where both paths cost about 2,081 USD.
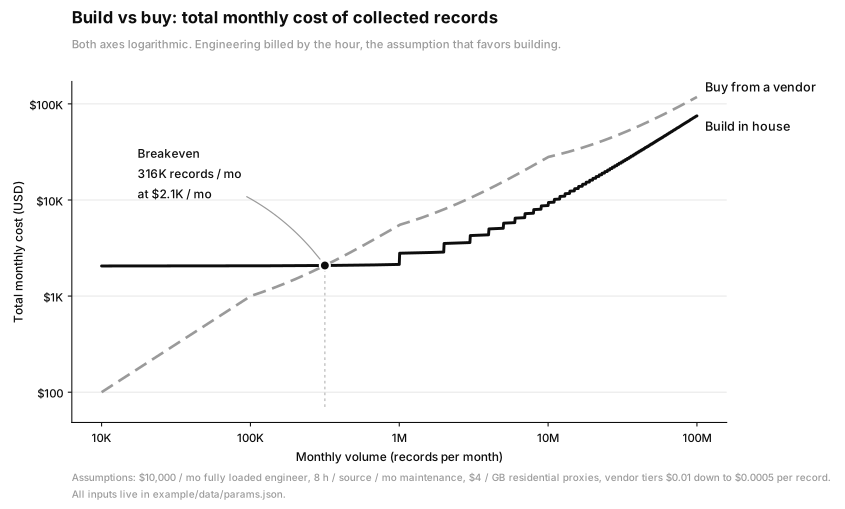
Look inside the in-house bill at that crossing, because a budgeting habit dies here. Engineering is 92 percent of the cost. Proxies are 25 USD. Compute is under a dollar. Most of the cost is people, and almost none of it is the script. Teams budget a build by imagining the collector script and pricing the proxy bill, then meet the platform floor, the maintenance, and the fact that all of it is engineer time.
That number hands whoever approves the budget a screening test. When a build proposal reaches your desk, check what fraction of it is people. If the line items are mostly tools, proxy bandwidth, and cloud, with the hours vague, the proposal has not found its own cost yet, because nine tenths of the real bill is missing. Send it back with three questions: whose hours, how many per month per source, and at what fully loaded rate. If those three answers are not most of the total, the total is wrong.
The base case also flatters building in a way I want in the open: it bills engineering by the hour, as if you could hire a fifth of an engineer. Companies hire whole people. Rerun the model in whole heads and the breakeven jumps from 316,266 to 2,953,691 records a month, 9.3x higher, with both sides near 10,384 USD at the crossing. So the answer is a zone. Defensible inputs put the crossing anywhere from about 100K to about 3M records a month, and where it lands inside that zone is mostly an accounting question about how your company pays for people. The model also answers the staffing question that follows the decision: one strong engineer carries about 13 sources, roughly 13M records a month, before collection stops fitting inside someone's week and needs dedicated people.
Before anyone argues, do the multiplication in your own units, because nobody budgets in records. A pricing team's volume is products tracked, times competitor sites, times refreshes a month. Picture a category manager watching 5,000 products across four competitor sites daily: 600,000 records a month, inside the zone, so the build question is real and turns on how you pay for people. Picture a brand team checking 200 listings weekly across three marketplaces: about 2,600 a month, nowhere near it, so buy the records or give an analyst an afternoon.
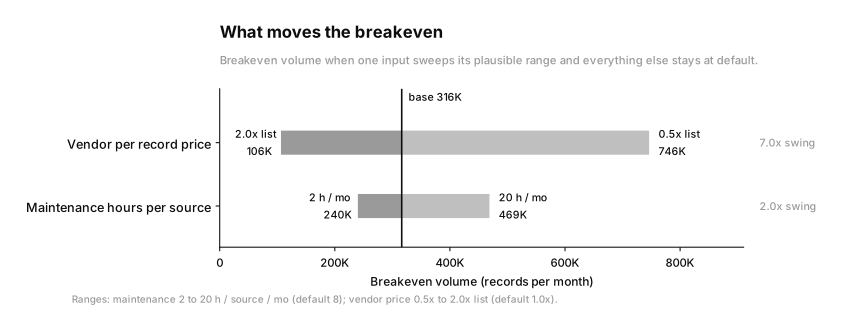
Then the sensitivity run, and this is where the model corrected me. Take the two most uncertain inputs and push each across its plausible range while holding the rest still. Sweep maintenance from 2 to 20 hours per source per month and the breakeven moves from 240,057 to 468,683 records a month, a 2.0x swing. Now price the vendor at double list and the crossing drops to 106,469; price it at half list, the low end of the model's range for quotes on the same specification, and the crossing climbs to 746,168. That is a 7.0x swing, and in absolute records the vendor price bar is 2.8 times wider than the maintenance bar.
I wrote a hypothesis in the chapter brief before this model ran, and the book's rule is that it gets judged in public. It said: the breakeven sits much higher than most teams assume, and it is driven by the maintenance tax, not the initial build.
Two parts held, one of them with a condition attached. Maintenance does dominate the build, and not subtly: over a collector's 24 month life the model charges 192 hours of upkeep against the 60 hour build, 3.2 to 1. You pay the build once, while maintenance comes back every month like rent that the sites you collect from keep raising without asking. "Higher than most teams assume" held under the accounting that actually applies to most companies: hiring whole people pushes the crossing out to 2,953,691 records a month, far beyond any casual guess. Billed by the hour it lands at 316,266, higher than a first instinct but not dramatically so. The claim survives with that condition stated.
The third part missed. Of the model's two uncertain inputs, the vendor's per record price moves the breakeven more than the maintenance tax does, 7.0x against 2.0x. Maintenance rules the in-house side, exactly as predicted, but the breakeven moves further with the number on the other side of the table. The practical order of operations inverts: get real vendor quotes first, then audit your own maintenance load. I would have told you the reverse, calmly and with authority, if I had not run the model. That miss is why every chapter here runs an experiment with the hypothesis written down beforehand, so the text cannot drift into whatever I already believed.
Cash that out now, because the fix is one email, sent three times. One quote is not enough to know the price: the model's range for quotes on the same specification runs from half of list to double it. Say a team needs 500,000 records a month: at list prices, billed by the hour, the crossing sits at 316,266 and building is on the table, while at half list it climbs to 746,168 and they should buy. The same team and the same need, flipped by paper they had not requested. So put one written specification, sources, fields, refresh rate, delivery format, in front of at least three vendors before any build gets approved.
These numbers have two edges. At the very top of the sweep, the vendor's best tier at 0.0005 USD per record undercuts the model's in-house marginal cost of 0.000736 USD per record, so if that tier price held, the vendor would retake the lead near 283M records a month; at extreme scale the question reopens rather than settles. And sometimes the answer is neither. Below the bottom of the zone, where a vendor's monthly minimums and setup fees that real contracts often carry, or your own platform floor, would dwarf the value of the data, the right tool is an analyst with a spreadsheet and an afternoon a week, or an official API's free tier, and no pipeline at all. The write-up shipped with the model lists further limits, including how the answer shifts when your sources yield fewer records than the model's million a month.
The maturity ladder
Nobody plans a data platform on day one. I have never seen a team that needed to. What happens instead is a ladder with four rungs, each one built out of the failure of the rung below, and knowing it in advance saves real money, because each rung fails in a predictable way.
It starts as a script. Somebody technical writes it in an afternoon, it fetches a modest pile of pages, and the numbers land in a spreadsheet that makes one meeting noticeably smarter. The script runs when its author remembers. Then the author takes a vacation, and the smartest chart in the company quietly freezes, which is how everyone discovers they had started depending on it.
So it becomes a scheduled collector: the same logic moved onto a server, running nightly, writing somewhere shared. This rung feels like victory. It is also where silent failure starts. The source redesigns, the parser begins returning empty fields, and the schedule keeps reporting green, because what is being checked is that the run happened, not that the data arrived. The gap between "it ran" and "it worked" is wide, and several later chapters live inside it.
The pipeline earns its third rung when somebody starts watching it: fill rates, today's volume compared against yesterday's, retries with growing pauses, an alert that wakes a person. Breakage stops being silent and becomes ordinary morning work. This rung breaks on the payroll arithmetic from the model above. Sources accumulate. Each one carries its 8 hours a month of rent. Somewhere near the 13 sources one engineer can hold, collection stops being a side duty and becomes a team, with a budget and somebody accountable for data quality by name.
The top rung is a data product: the schema becomes a promise to the people who consume the data, delivery gets verified at the destination, and a quality gate catches a bad batch before anyone downstream is hurt by it. Records nobody inside the company has to think about. You have become, internally, the vendor this chapter's model priced, and their per record price was paying for this same ladder, spread across every customer they have.
No cost model survives collecting data you had no right to touch. So before any of this, one question: what is fair to take from the public web, at what load, and under which rules, written and unwritten.
Run the experiment yourself. The complete example ships with this chapter: the data, run.py, pinned dependencies, and the written analysis. It runs offline on a laptop.
Download the code and data (0.1 MB) · then pip install -r requirements.txt and python run.py