The Data Collection Handbook · Part III. Trusting the Data
Chapter 8. Data Quality and Validation
A bottle that cost twenty-four dollars once went out in one of our deliveries at two thousand four hundred. About a third of the prices in that file were wrong the same way, shifted by a factor of a hundred, because a currency field upstream had changed shape. The client called it a failed delivery. By every measure the pipeline kept, it had not failed: the file arrived on time, in the right format, at the right place, with the right number of rows. The pipeline had no opinion about whether a price was believable, only about whether a row showed up. To the machine, a delivered file and a correct file were the same file. The client could tell them apart.
Delivered and correct are two different claims, and most collection systems only ever prove the first. Part II got the data in the door. This chapter is the second claim, that the data is actually right, proved the only way that counts: with a validator you have tested against errors you planted yourself, so that we validate our data stops being a feeling and becomes a number.
Quality has five dimensions
Before you can check quality you have to say what you mean by it. I use five dimensions, a teaching cut rather than a standard, and a dataset can ace four and fail the fifth into uselessness. Completeness: are the fields actually populated, or are they quietly empty. Validity: does each value have the right type and form, a price that is a number, a date that is a date. Consistency: do values agree with each other, does the in-stock flag match the stock count, does the total match the parts. Freshness: is the data from when it claims to be, or did a stale run get redelivered. And plausibility: is the value believable for what it is, a price above zero and below the sky, a rating inside its scale. My hundred-fold price error passed completeness, validity, consistency, and freshness. It failed only plausibility. Almost nobody checks that dimension, because it is the only one that requires you to know something about the world the data describes.
The validation pyramid
Turn those dimensions into checks and they stack into a pyramid, cheapest at the base. Each layer catches something the layer below it cannot see.
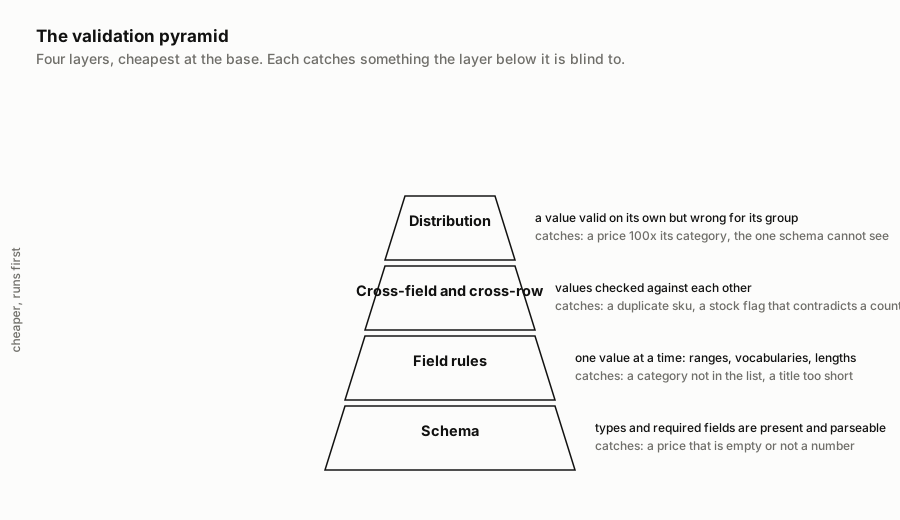
The base is schema validation: is every required field present, and does each one parse as the type it should be. This is cheap, fast, and where most teams stop, and stopping here is the mistake the experiment below measures. One step up are field-level rules, checking one value at a time against what it is allowed to be: a rating between one and five, a currency from a known set, a category that exists in your vocabulary, a title longer than a plausible minimum. Above that sit cross-field and cross-row rules, which check values against each other rather than in isolation: a product identifier that must be unique across the dataset, a stock flag that must not contradict a stock count. And at the top, the layer that would have caught my price disaster, is distribution validation: checking a value not against a fixed rule but against its own peers, so that a price multiplied by a hundred, now sitting far above everything else in its category, gets flagged because it looks fine on its own and absurd next to its peers. Schema would wave that twenty-four-hundred-dollar bottle straight through, because twenty-four hundred is a perfectly good number. A per-category price ceiling one layer up would catch many such cases; in this chapter's experiment, only the distribution layer did.
Fill rate is the master signal
If you build only one quality check, build this one, because it is the cheapest and the most sensitive early warning there is. Fill rate is the share of rows where a given field arrived with a real value, tracked per field, over time. It sounds trivial. It is the best detector of the most common silent failure in collection: a selector or a parser breaks, and a field that was always there stops arriving, while everything else about the run looks normal.
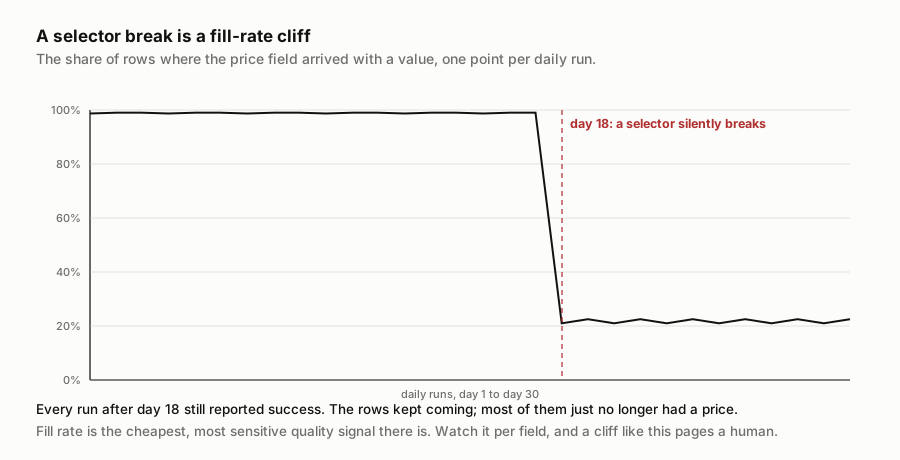
Watch what the picture shows, because it is exactly the shape of a real incident. For more than two weeks the price field is populated on ninety-nine percent of rows. Then on day eighteen something upstream shifts, the extractor that used to find the price finds nothing, and from that day forward the field is populated on one row in five. Nothing else changed. The job still ran, still finished, still delivered its usual row count, still reported success, because Chapter 6's discipline held and the missing prices were recorded as gaps rather than invented zeros. But the value the customer is paying for fell off a cliff, and the only thing that saw it was the fill rate. A per-field fill-rate monitor turns that cliff into a page to a human on day eighteen. Without it, the first person to notice is the customer, three weeks later, asking why most of their prices are blank. Chapter 10 is about monitoring like this. Here, fill rate is where you start, because it costs almost nothing.
Plausibility is where domain knowledge lives
The upper layers of the pyramid are where you encode what you actually know about the data, as executable rules. A price is above zero and below some ceiling that makes sense for the category. A date falls inside a sane range, not in 1970 and not next century. A discount is between zero and a hundred percent. A category is one of the values you know exist. Each of these is a small piece of domain knowledge, the kind that lives in an experienced analyst's head, written down as a check a machine runs on every row. Keep writing them down as you learn them. Every plausibility rule came from some past bad batch, and writing it down is what stops the same batch shipping silently a second time.
Seed errors and count
You have a validator. How good is it, as a number rather than a feeling? The only way to answer is to hand it errors you planted yourself, at positions you recorded, and count how many it catches. This is error seeding, and it is how a validator becomes a control instead of a comforting story.
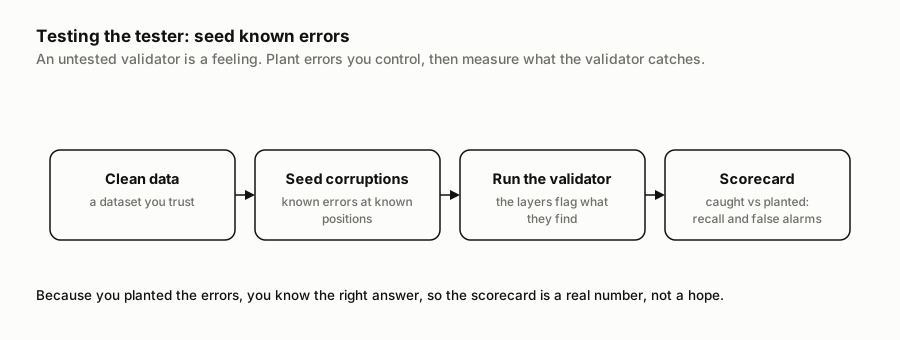
So the example does exactly that. It ships a synthetic but realistic
catalog of ten thousand products, seeds five kinds of error that I have
watched happen in production, forty of each at known rows, and runs a
four-layer validator over the result. Five error types: a nulled-out
price, a price unit-shifted by a factor of a hundred, a truncated title,
a duplicated row, and a category value outside the known vocabulary.
Then it scores each error type by how many the validator caught, and,
just as important, notes which layer of the pyramid did the catching.
Everything is seeded from a fixed seed, so python run.py
reproduces the whole scorecard.
The run made the case better than I had. The schema layer, the cheap base of the pyramid where so many teams stop, implemented here as the usual type and presence checks, caught exactly one of the five error types: the nulled price, which failed to parse as a number. That is all. It waved through the truncated title, the bad category, the duplicate, and, most dangerously, the hundred-fold price error, because every one of those is, to a schema check, a perfectly valid-looking value. One error type in five. The layers above it, the field rules, the cross-row check, and the distribution check, caught the other four between them. If you had only schema validation, which is the real state of a great many pipelines I have seen, you would have shipped four of these five error types without a whisper.
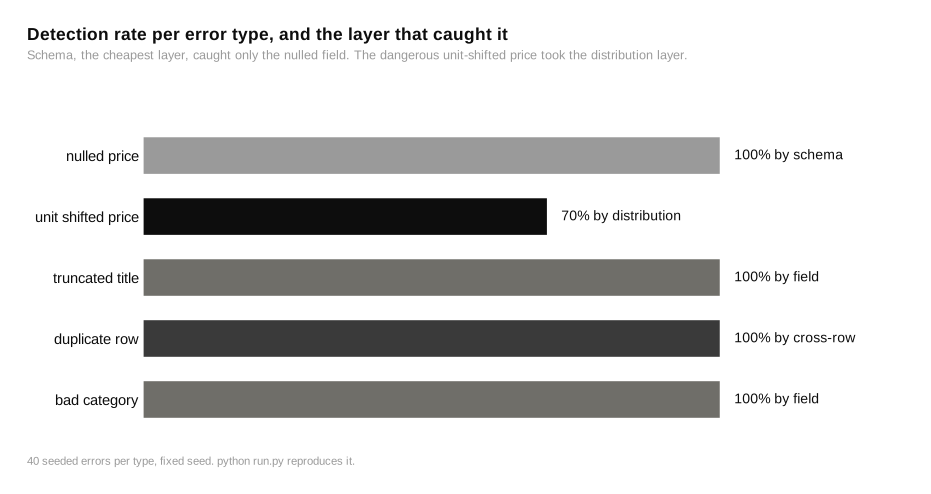
Two dents in the result, because a scorecard that reports only its wins is the dishonesty I am arguing against. First, the distribution layer caught the hundred-fold price error, the one that mattered most, but it caught only seventy percent of them. The other thirty percent slipped through for a plainer reason: the check measures how far a log price sits from its category's center in units of that category's own spread, and in the widest categories a hundred-fold jump did not always reach the cutoff the run used. Loosen the cutoff and you catch them, at the price of more false alarms; distribution checks are a dial, not a wall. Seventy percent caught is far better than the zero percent schema managed, and it is not a hundred, and I would be lying if I told you it was.
Second, the title-length rule caught every single truncated title, all forty, which sounds like a triumph until you count what else it flagged. It also raised forty-three alarms on titles that were not seeded errors at all: real, complete, two-word product titles like a short brand name and a three-letter noun, that happened to fall under the minimum length the rule enforced. On inspection, every one of those forty-three was a false alarm, a legitimately short title the blunt rule could not tell from a truncation. That gives the title rule a precision of forty-eight percent: fewer than half the rows it flagged were actually wrong. That forty-eight percent was invisible until I seeded errors and counted, and that is why seeding is worth the trouble. A validator that flags things feels like it is working. Only when you know the true answer can you see that it was crying wolf more often than not, and decide whether to live with the noise, tune the threshold, or make the rule smarter. The follow-up is a real engineering choice, and you cannot even have the conversation without the number.
That is why you test the tester. The seeding turned three vague good feelings, we check our schema, we validate titles, we catch outliers, into three facts: schema catches one problem in five, the outlier check misses three price errors in ten, and the title rule is wrong more than half the times it complains. None of those facts is visible from reading the validator's code or watching it run on data whose errors you do not already know. They only appear when you plant the errors yourself.
The quality report ships with the data
All of this rolls up into one artifact I now attach to every delivery: a one-page quality report that travels with the data itself. Per-field fill rates for this batch against the last one. The count of rows flagged by each validation layer, and what the flags were. The freshness of the underlying collection. A short note on anything the validator caught and anything it is known not to catch. It costs almost nothing to generate, because the validator already computed every number in it, and it changes the entire conversation with whoever consumes the data. Instead of them discovering a problem in production and calling it a failure, they see the shape of the batch before they act on it, and the rare bad batch gets caught at the door by a person who was handed the evidence. I can stand behind a dataset that ships with its quality report. A bare file is a hope with a filename.
That is as far as row checks go, and they have a blind spot. Every check here operates on rows that exist. A validator can tell you the prices you collected are believable, the categories valid, the titles complete. It has nothing to say about the products you never collected at all, because absence leaves no row to test. You have proven that what you have is correct. Whether you have all of it is a different question, and the full list is the one thing you cannot see.
Run the experiment yourself. The complete example ships with this chapter: the data, run.py, pinned dependencies, and the written analysis. It runs offline on a laptop.
Download the code and data (0.8 MB) · then pip install -r requirements.txt and python run.py